Reporting and Data Analysis
Internal report building
Submitted data can be visualized in the reports section of NEMO. Enumerators are only able to generate reports from their own submitted responses. Reviewers, staffers, coordinators and admins can generate reports from data submitted by all users.
To create a new report:
Click Reports menu.
Click Create New Report.
Tally report
Shows Aggregated tallies of answers or responses, grouped by attributes of interest. If selected, the following prompts/options are available:
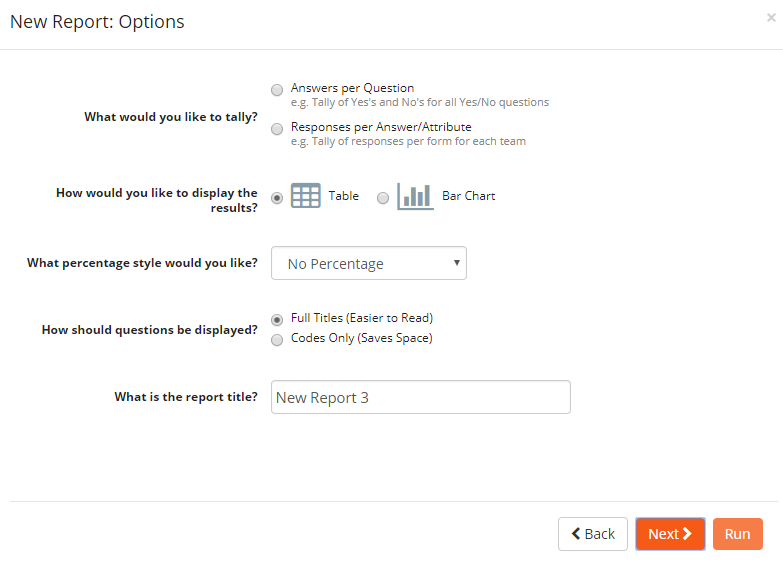
Select how you would like to tally.
Choose between Table or Bar Chart results display.
Select How should questions be displayed.
Type a name for the report.
Click Next.
Select the forms you want to include in your report then click Next.
Select the questions for row headers.
If needed, select the questions for column headers.
Click Run.
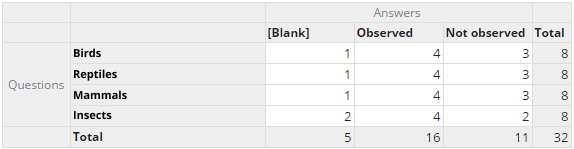
Example of answers per question Table display
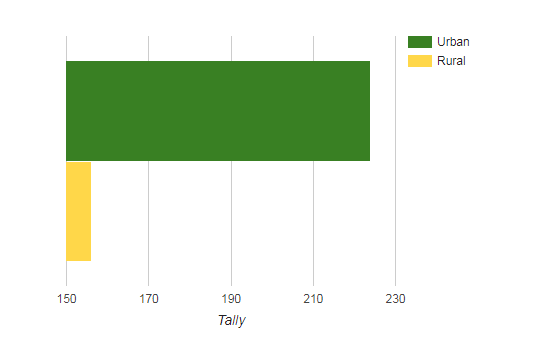
Example of responses per answer/attribute Bar chart
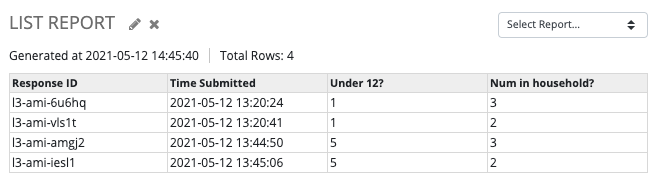
List report
A raw listing of answers and attributes for a set of responses. If selected, the following prompts/options are available:
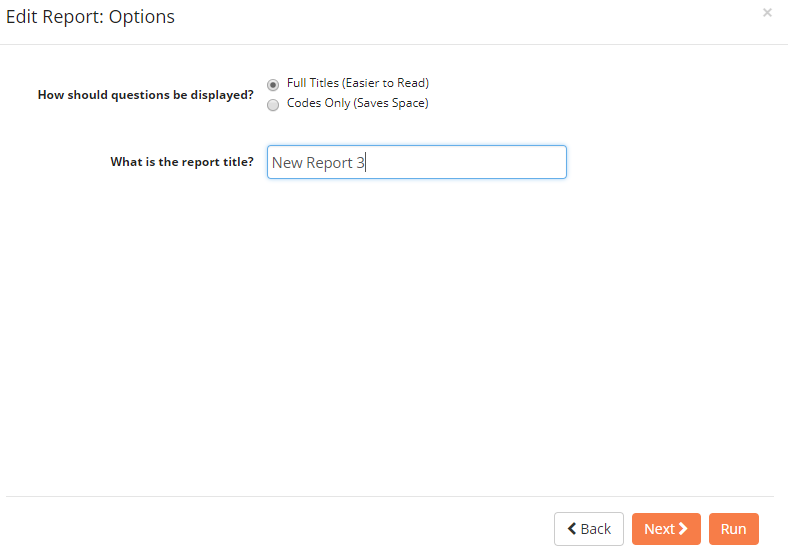
Select How should questions be displayed.
Type a name for the report.
Click Next.
Select the forms you want to include in your report then click Next.
Select the columns you want to include then click Run.
Example:
Standard report
A question-by-question summary of the responses for a specific form. The purpose of this report is to help give a ready-made overview of responses for a specific questionnaire. If selected, the following prompts/options are available:
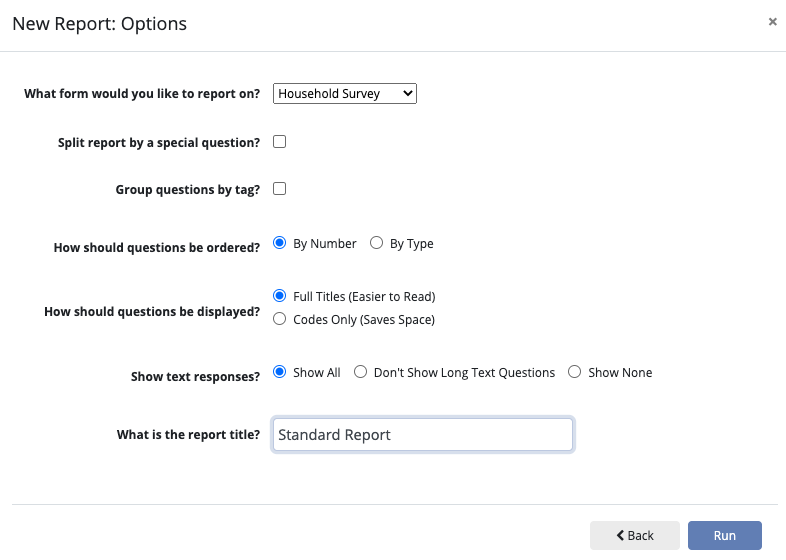
Select the form you would like to report on.
If needed, check Split report by a special question.
If needed, check Group questions by tag.
Choose whether to order questions By Number (the order they appeared in the form) or By Type.
Select How should questions be displayed.
Choose how text responses should be displayed.
Type a name for the report.
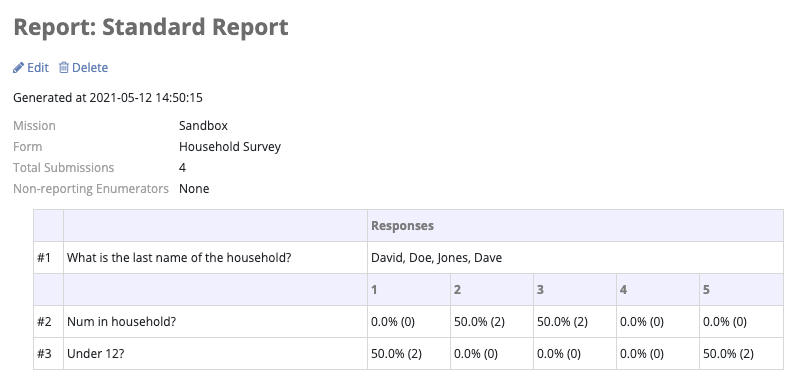
Example:
Exporting to spreadsheets (.csv)
If the options available within the Reports section do not meet mission needs for analyzing collected data, the data can be exported to a CSV file. To export data:
Click Responses menu.
Click Export to CSV Format.
Tally and List reports can also be exported to a CSV file:
Click Reports menu.
Click the report to be exported.
Click Export Data To CSV Format.